Creating a Security Components Report
This guide will build on the principles from the “Connecting to the Database via Excel” guide and also expect you to connect to the BI.UserApplicationComponentPermissions view and create a pivot table as described in the principles of that document. It also assumes you have familiarized yourself with the Introduction document.
- Follow the Connecting to the Database via Excel guide to create a connection to the DSS database. In a slight departure from that document, we would connect to the BI.UserApplicationComponentPermissions view instead of BI.DataSecurityAssignedToUser view.
-
After the data is pulled into a pivot table, it is best to have a filter for the Active User Flag. This allows you to filter on Active or Inactive users (if desired). There are numerous ways to run this particular report. I may want to see all permissions available for a particular user (example report below). Additional report types listed in the headers below:

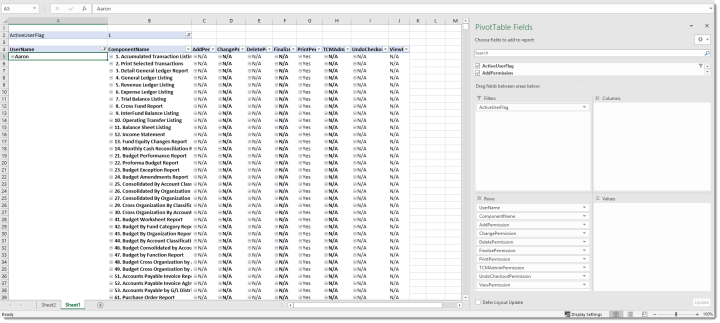
Security Components by User Name
Potential Use: A list of security permissions for all users, a single user or a subset of users. This report would be filterable by one or multiple security components using delivered Excel functionality.
Example Filter fields: ActiveUserFlag
Example Row fields: UserName, ComponentName, AddPermission, ChangePermission, DeletePermission, FinalizePermission, PrintPermission, Content ManagerAdminPermission, UndoCheckoutPermission, ViewPermission
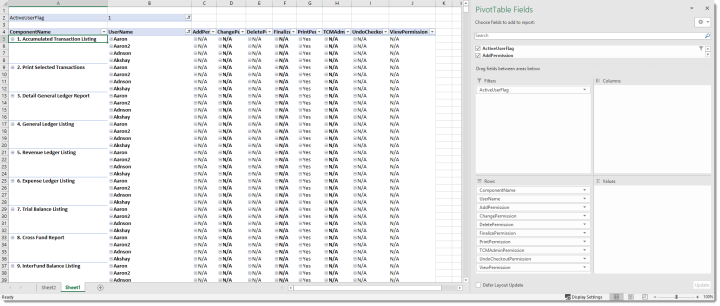
User Names by Security Component
Potential Use: This report could be helpful to determine whether users who should not be authorized to a security component have access, or vice/versa. Filters can be applied using the delivered Excel dropdowns on the ComponentName and UserName fields to compare by specific components or user names.
Example Filter fields: ActiveUserFlag
Example Row fields: ComponentName, UserName, AddPermission, ChangePermission, DeletePermission, FinalizePermission, PrintPermission, Content ManagerAdminPermission, UndoCheckoutPermission, ViewPermission